I run three WordPress blogs, which means I’m constantly checking Google Analytics for user engagement, Search Console for traffic insights, and AdSense for revenue.
These tools get the job done, but they can be frustrating to use.
They’re packed with features I rarely use, and the insights I care about are buried under layers of menus and tabs. Answering simple questions like “Which pages bring in the most conversions?” or tracking user journeys across my website requires hiring a developer or spending hours figuring it out myself.
If you manage website content, run a business, or rely on data to make decisions, you’ve probably felt the same. The tools are powerful, but they’re not exactly built for speed, simplicity, and quick decision-making.
Papermap is a business intelligence platform that removes this bottleneck.
This is why I was curious to try it out. I signed up, tested its features with a dummy company, and this article shares everything I found.
What Is Papermap?
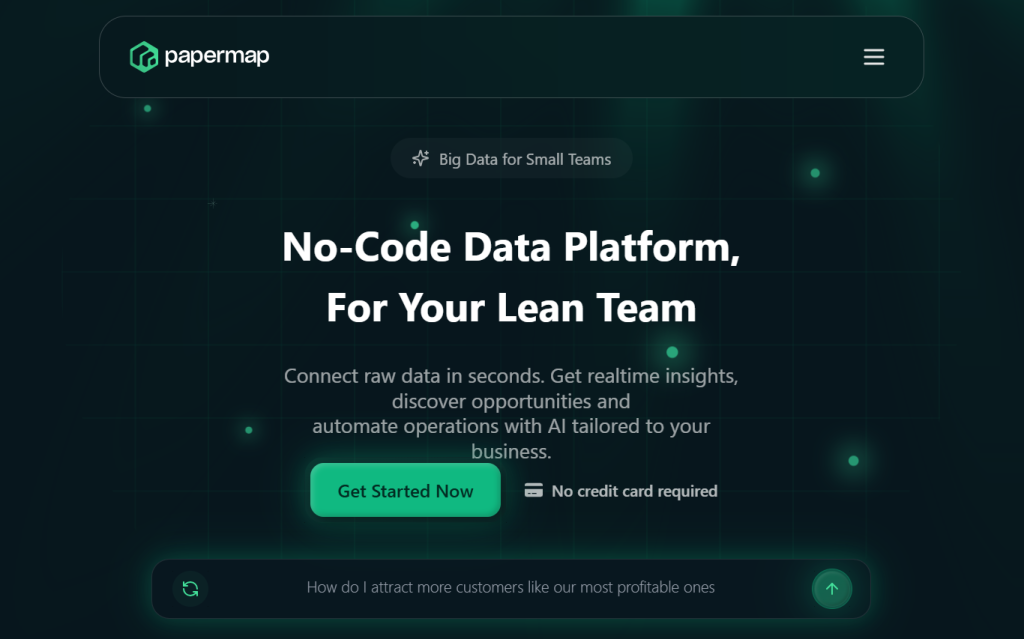
If ChatGPT and Tableau had a baby, it would be Papermap.
It’s an AI-powered business intelligence platform that helps you uncover insights quickly, without writing a single line of code.
Its clean interface, conversational AI, instant dashboard builder, and built-in collaboration tools make it easy to use—even if, like me, you’ve never worked with analytics software before.
You can pull data from multiple sources into one place, giving you a real-time overview of performance across your entire business, from operations and finances to marketing and user retention.
Getting Started With Papermap
As a blogger and freelance SaaS writer, I spend a lot of time testing dozens of tools. And out of the many platforms I’ve tried, Papermap is one of the easiest to get started with.
After signing up, you’re guided through a simple onboarding process where you share a few basic details about your business.
Papermap uses this information to set up your workspace, generate dummy data to explore the platform (optional choice), and down the line, conduct accurate competitor and benchmarking analysis.
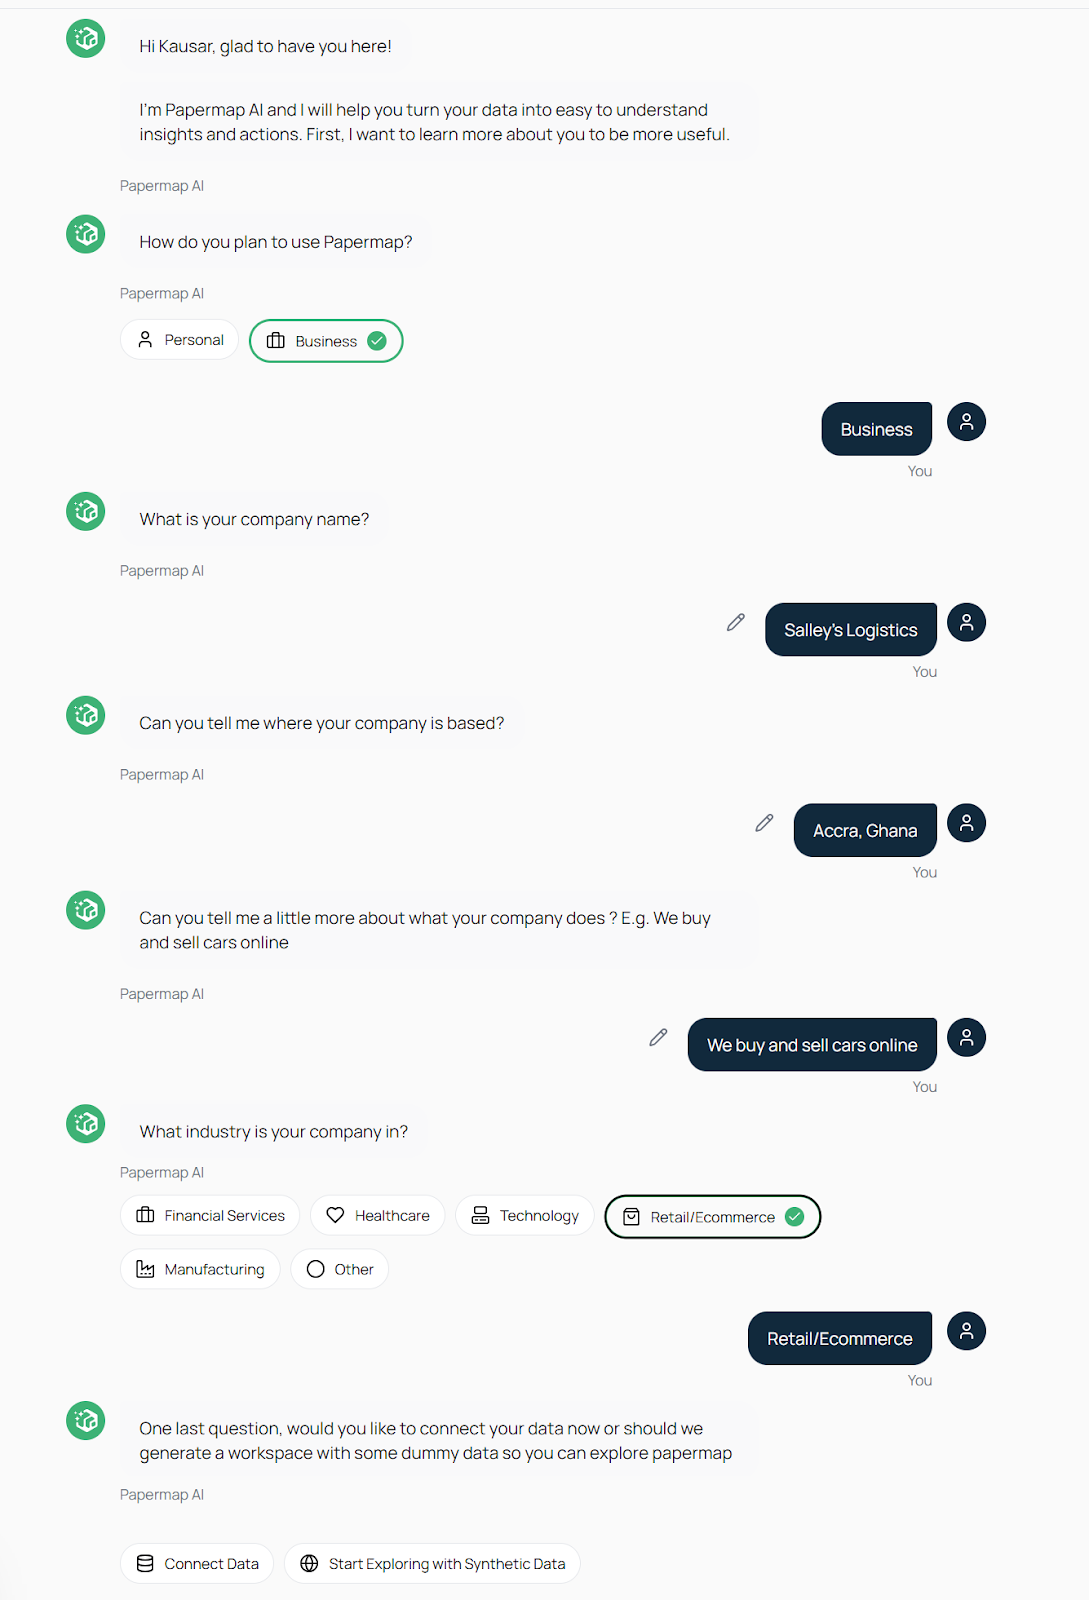
When onboarding is complete, you can either connect your own data right away or explore the platform with synthetic data.
Since this was my first time using Papermap, I chose to work with synthetic data to get familiar with its features.
If you’d rather use your own data, Papermap lets you connect spreadsheets (CSV, Excel, or Google Sheets) as well as traditional databases like PostgreSQL, MySQL, MongoDB, and Supabase. You can also pull data directly from tools you already use, such as QuickBooks and Google Analytics.
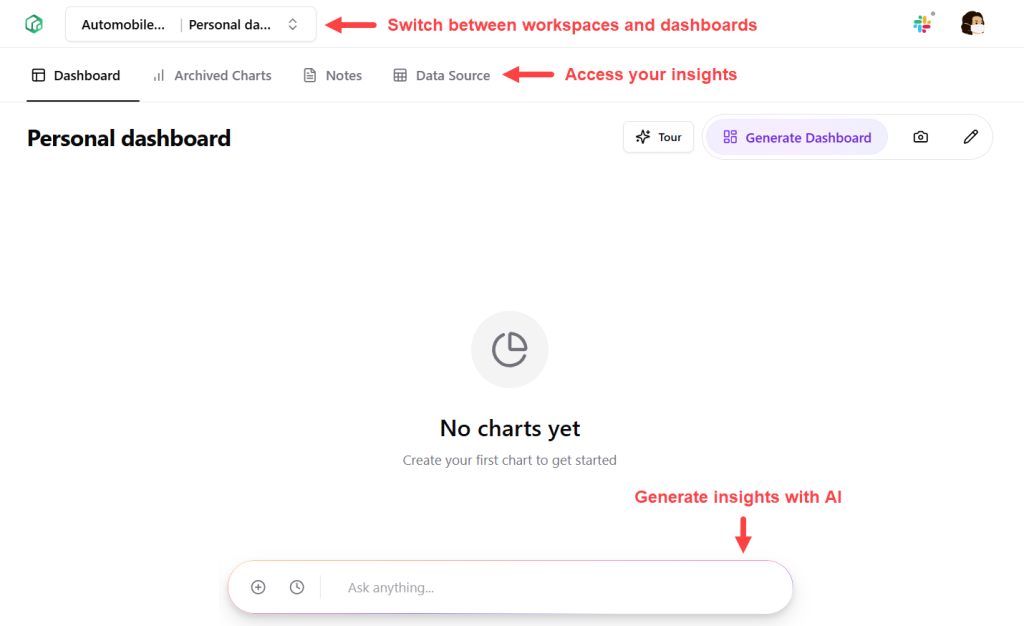
From there, you’ll get access to your main dashboard.
I love how the dashboard is clean, modern, and easy to navigate. All the tools you need are just a click away, and there’s even an in-app tour to ensure you’re up to speed with the interface in no time.
Papermap Standout Features for Surfacing Relevant Business Insights
At first, Papermap’s dashboard is a blank slate.
This might feel intimidating, like yeah well, I need to spend hours filling it up with the charts I need.
But you don’t.
Papermap’s AI command center and dashboard generator handle most of the work for you. Your job is to tell them what you need, and they’ll get it done.
In the next sections, I’ll walk through how I used these tools to build my dashboard and, if you’re working with a team, how easy it is to share and collaborate along the way.
1. Generate Dashboard
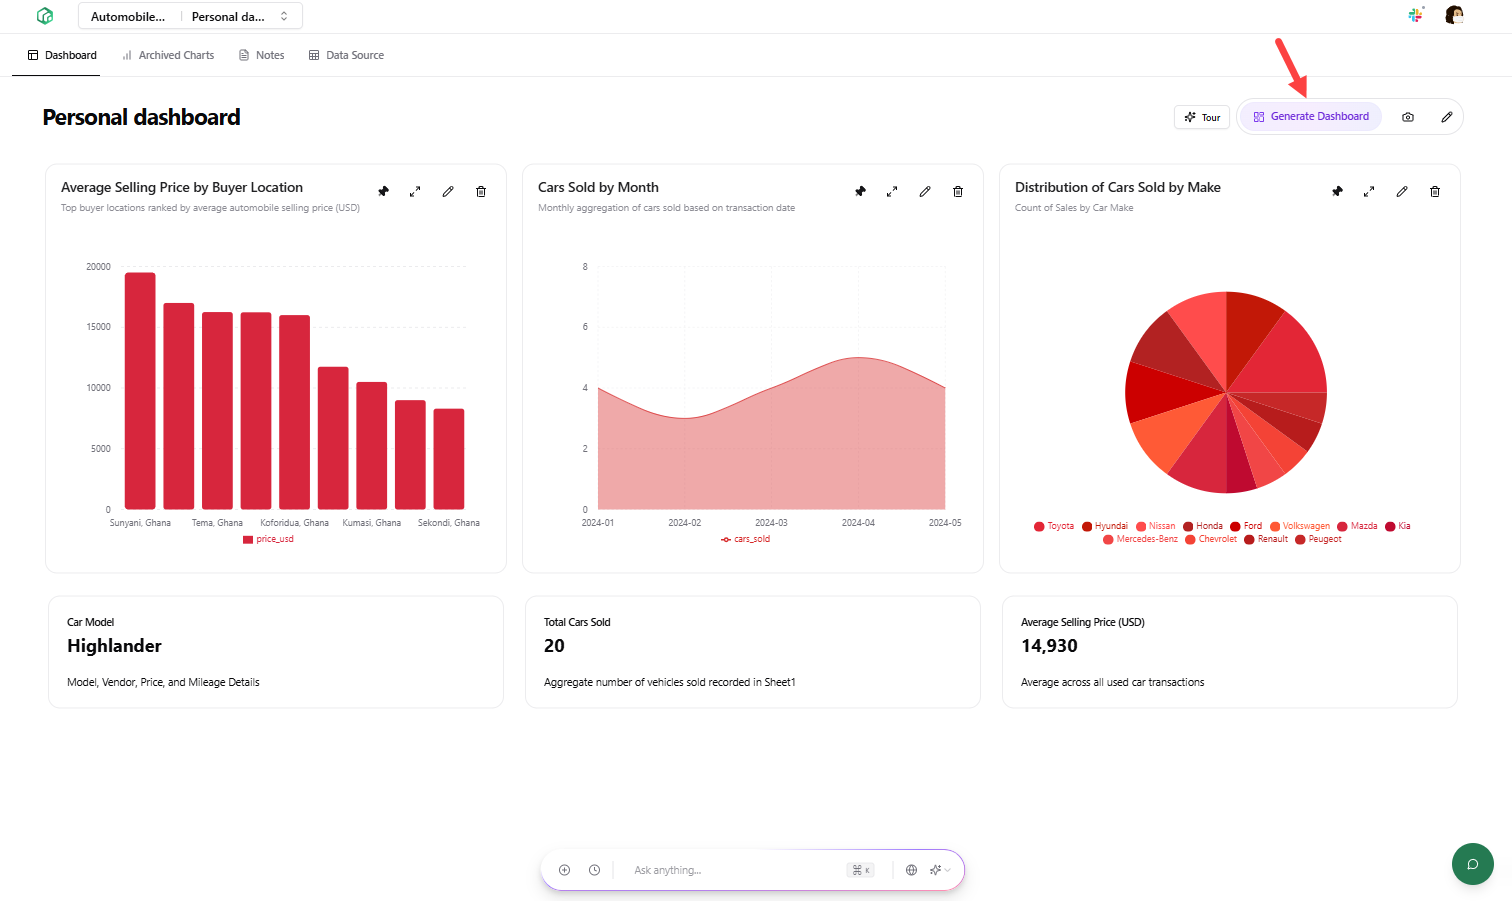
How did I go from a blank canvas to the fully built dashboard below in just a few seconds?
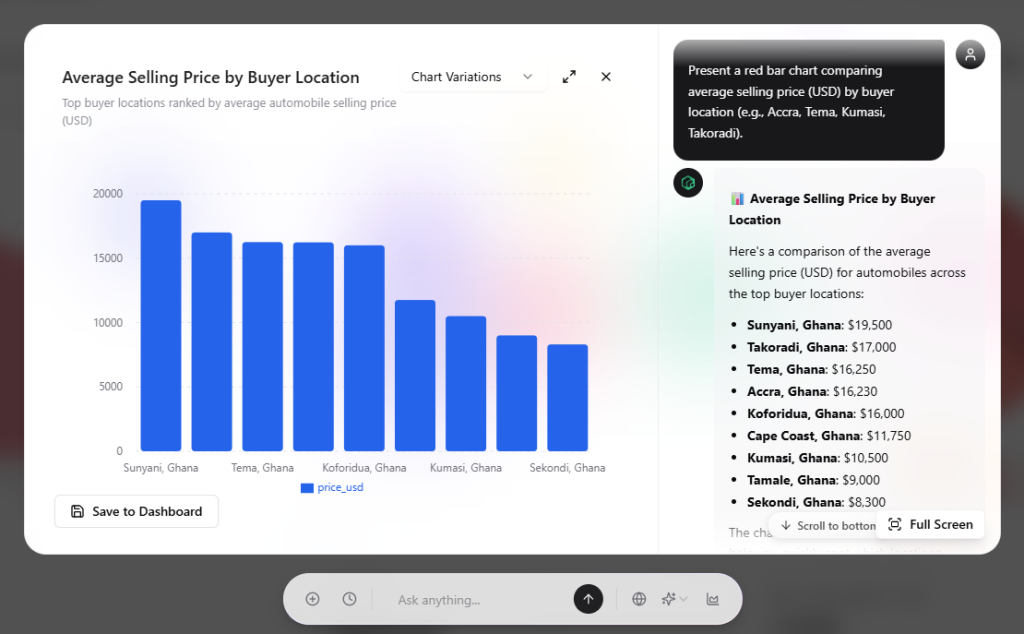
I clicked the Generate Dashboard button in the top bar. Papermap instantly created charts that surfaced the key insights from my data.
These aren’t static visuals. They’re fully interactive charts that:
- Update in real time as new data comes in
- Let you hover over data points to see exact values
- Support different layouts like bar charts, stacked charts, and horizontal graphs
You can also move charts around, resize them, or delete anything you don’t need.
For instance, I noticed the x-axis labels on the “Average Selling Price by Buyer Location” chart were cut off due to limited space. Expanding the chart’s width fixes the issue and displays the details in full.
Now here’s my favorite part:
Clicking the pencil icon on any chart takes you behind the scenes. You’ll see the AI prompt that generated the chart, and you can send follow-up prompts to make additional edits.
In my case, I asked to make the bars thinner and change their color to blue. The color updated right away, but the bar width stayed the same. That request didn’t go through. But to be fair, a bar width doesn’t carry any significance and the current size looks just fine.
So yes, these auto-generated charts aren’t set in stone. You can use follow-up prompts to tweak their styling, reorder data points, or display data within specific ranges.
But here’s the thing: any edits you make apply to the current chart.
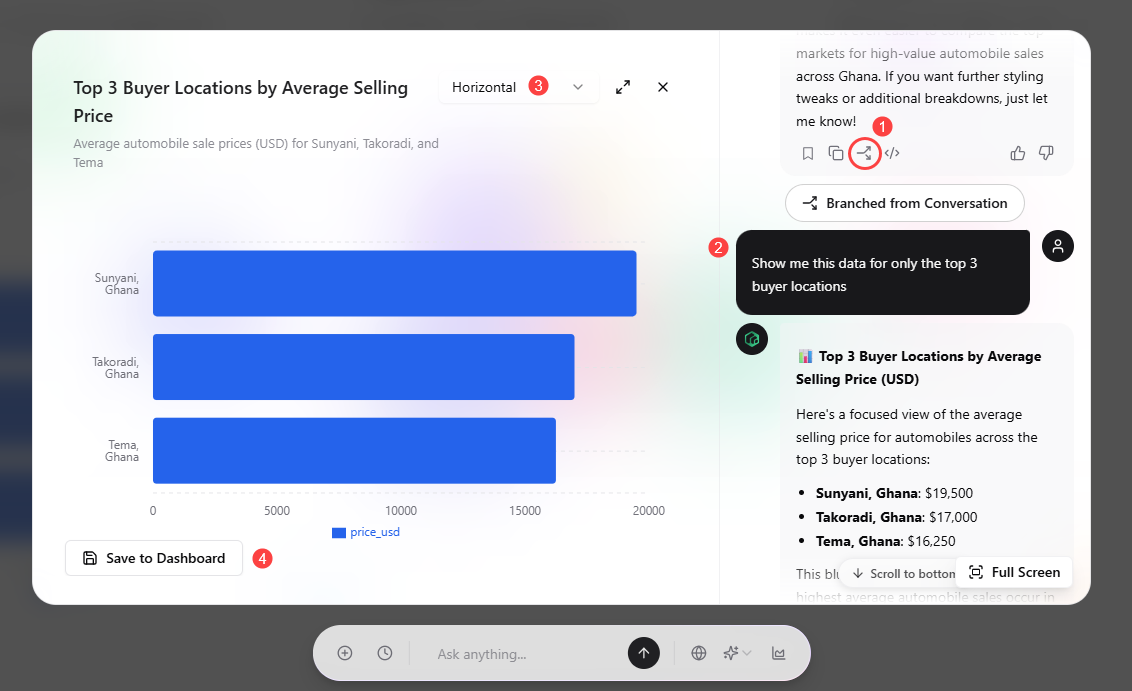
So what if you want to keep the current chart but create a new version with similar context?
That’s where branching comes in.
Papermap lets you branch into a new conversation that inherits previous context (like “average selling price by buyer location” chart with blue bars), and build on it with custom tweaks. Once you’re happy with the changes, you can save it to your dashboard..
2. AI Command Center
Besides the dashboard generator, Papermap has a built-in AI chat assistant called Alan. You can ask Alan questions about your data in plain English, and it’ll serve your answers right away.
So instead of endlessly digging through spreadsheets or pinging teammates to find out basic things like your top-selling products, best-performing locations, or VIP customers, ask Alan and get an instant answer.
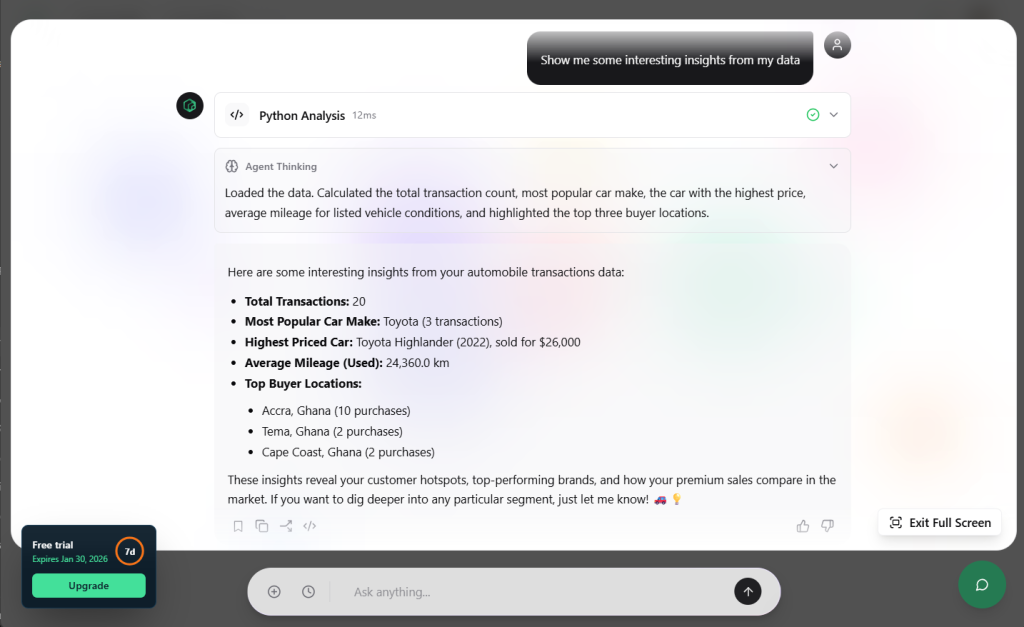
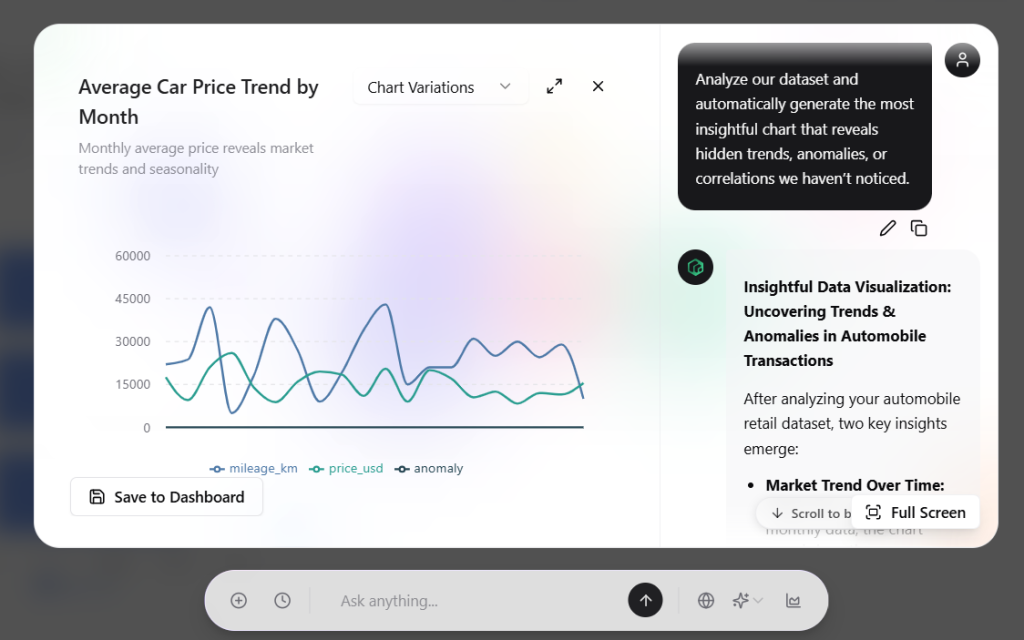
You can also dive deeper into your data to uncover any revenue leakages, anomalies, correlations, or hidden trends. Alan will generate charts right inside the chat to help you visualize these insights. Again, you can customize these charts and save them to the dashboard to keep track of them at all times.
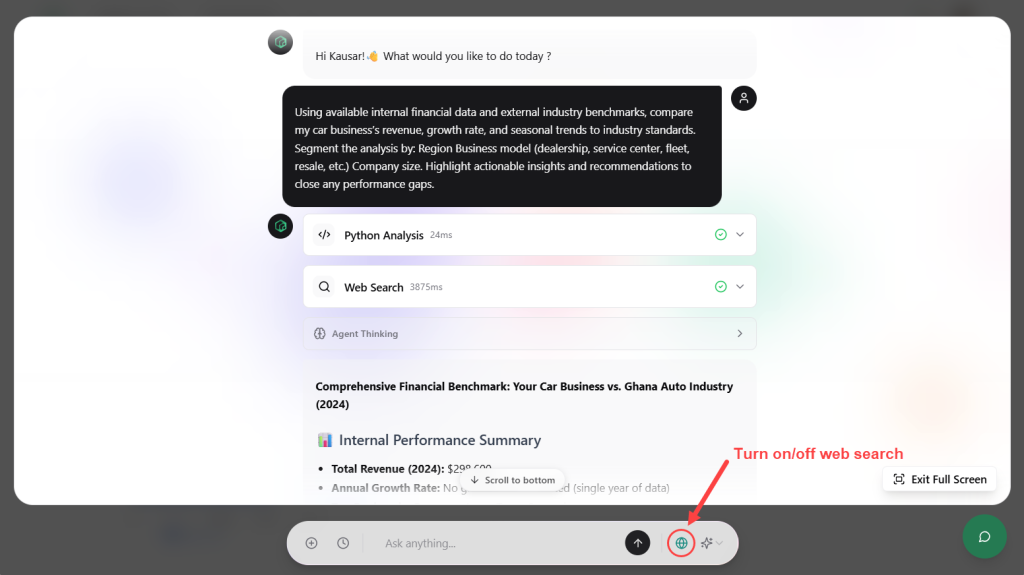
While chatting with Alan, you can turn on its web search feature to help with competitive research and benchmarking.
When I tried it, Alan mentioned that having at least two years of data would give more accurate benchmarks. Still, it shared some helpful insights on industry trends, performance gaps, and actionable steps for revenue growth (and a reminder to keep tracking my revenue for future analysis.)
One thing that stood out was that Alan includes links to the sources it pulls from. And when I checked, I noticed they were all recent and pulled from reliable sources. This gave me confidence in Alan’s research skills and trust that its insights will always be based on real, up-to-date information.
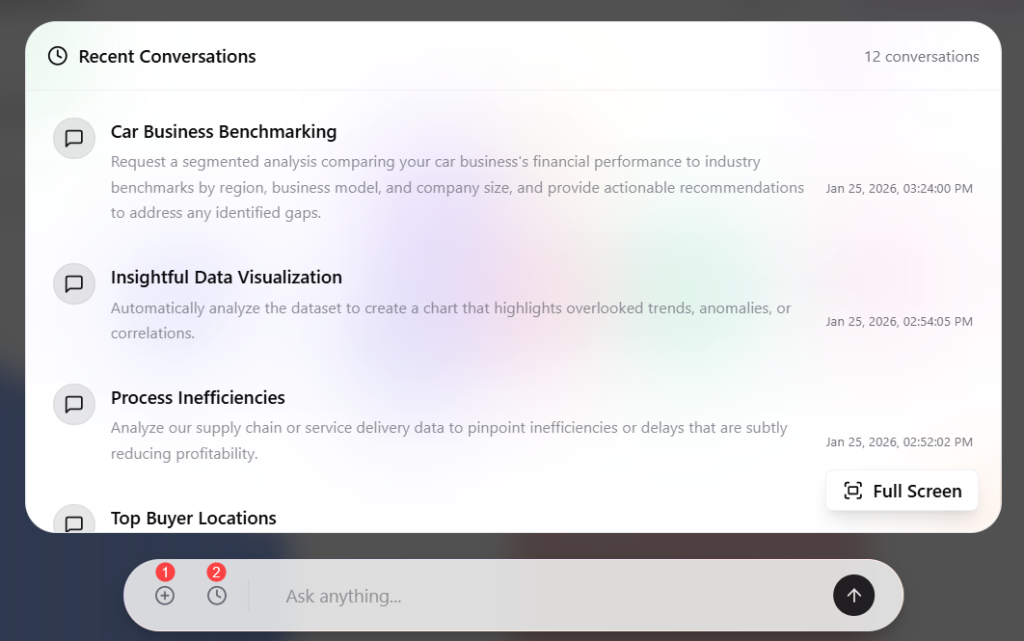
If you ever close a chat with Alan by mistake, your conversations aren’t lost.
You can view recent chats directly in the command center and pick up where you left off, or start a new chat to explore insights around other areas of your business.
3. Team Collaboration
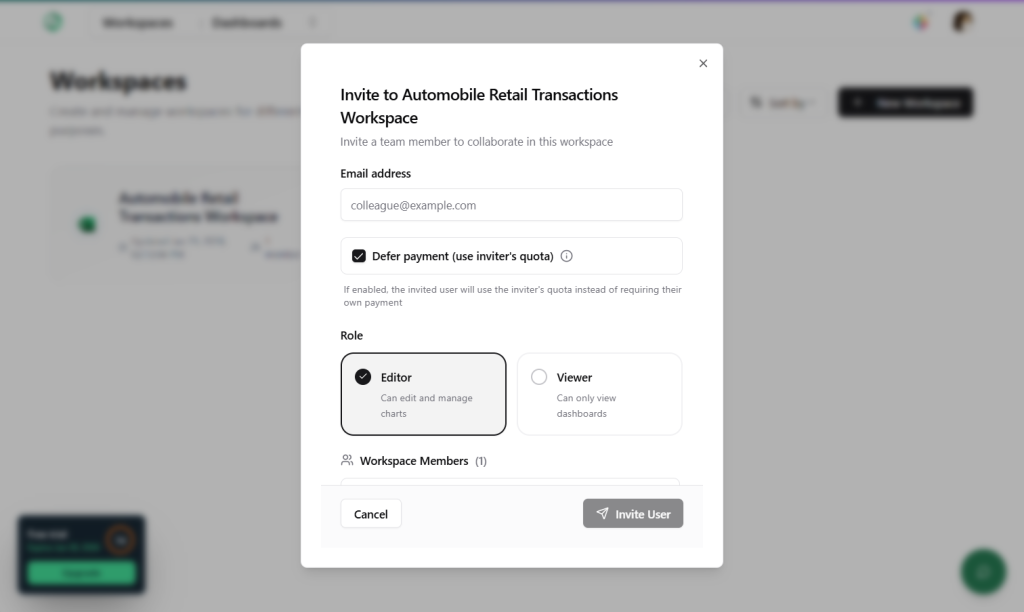
Papermap makes it easy to work with your team, whether you want to build dashboards together or share key insights with leadership.
You can add teammates to your Workspace as either viewers or editors.
Each Workspace includes multiple dashboards. This means when you add someone to a workspace, they automatically get access to all the dashboards within it, with the level of permission you assigned.
Plus, you can connect Papermap to your team’s Slack workspace.
Once connected, you can access Papermap’s AI directly inside Slack—just tag Papermap, ask your question, and it’ll generate the relevant answers and charts right there for you and your team.
How Much Does Papermap Cost?
Papermap has a 7-day free trial for anyone looking to explore the platform and its features.
The Hobby plan is $19/month and is ideal for solo users with basic data analysis needs.
The Business Essential plan costs $50/month and includes access for 3 users and up to 5 workspaces, making it a good fit for small teams.
For medium to larger companies that need to embed Papermap’s functionality into their own apps, the Business Pro plan (costs $299/month) or Ultra plan are more suitable for your needs.
| Hobby($19/month) | Business Essential($50/month) | Business Pro($299/month) | Ultra(Custom) | |
| Workspaces | 2 | 5 | Unlimited | Unlimited |
| No. of users | 1 | 3 | 5 | Unlimited |
| Daily requests | Unlimited | Unlimited | Unlimited | Unlimited |
| Monthly credits | 100 | 500 | 1000 | Unlimited |
| Embed Papermap in external app | ❌ | ❌ | ✅ | ✅ |
| White-label with multi tenant support | ❌ | ❌ | ❌ | ✅ |
| Dedicated development support | ❌ | ❌ | ❌ | ✅ |
My Final Thoughts on Papermap
Papermap simplifies the entire data analytics process, from setup to insight.
Once you feed it your raw data, it does the heavy lifting and presents you with clean, easily digestible, and actionable insights that move your business forward.
Whether you’re a solo founder or part of a large team, as long as you have business data across one or multiple departments, you’ve got nothing to lose, and so much to gain from connecting it to Papermap.
You’ll be amazed what you find.